EXPLAINED | Why Are Festive Auto Sales Sending Mixed Signals?
Have Indians stopped buying cars this festive season? The early numbers show a slowdown in passenger vehicle registrations. Calling it a collapse in demand would be premature.
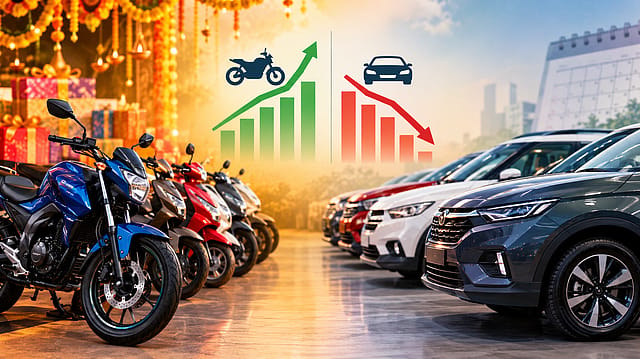
According to a recent Jefferies report, two-wheeler registrations rose 16% year-on-year during the first 14 days of the festive season, while passenger vehicle registrations fell 6%. That is a 22-percentage-point gap between their growth rates.
The passenger vehicle figures also weakened as the period progressed: registrations were up 7% in the first seven days, before the cumulative fortnightly figure turned negative. That suggests a weaker second week, although the reported percentages alone cannot tell us its precise decline.
FIRST, WHAT EXACTLY ARE THESE NUMBERS COUNTING?
Registrations: vehicles recorded with transport authorities. They are commonly used to track retail purchases.

Look Who's Talking Regime Change
23 Oct 2026 - Vol 05 | Issue 43
Wholesales measure something different: manufacturers dispatching vehicles to dealers. A car can reach a showroom without finding a buyer that month.
That distinction matters. Rising factory dispatches can reflect preparations for a festive rush. Registrations provide evidence of vehicles reaching customers, though registration and delivery dates need not line up perfectly.
Bookings are another stage again. An order signals interest; it still has to become a completed purchase.
SO WHY ARE BIKES DOING BETTER THAN CARS?
Jefferies’ figures establish the divergence. They do not, by themselves, establish its cause.
Two-wheelers and cars involve different purchase budgets, financing requirements and replacement decisions. Those are factors worth examining. The figures supplied do not isolate their contribution.
The wider trend does show that two-wheelers entered the festive period with momentum. Between April and September, their registrations rose 22% year-on-year and wholesales increased 17%, according to the report.
But passenger vehicles had a strong first half too: registrations and wholesales grew around 28–29%.
The question is whether the festive weakness persists after that expansion. Two weeks cannot settle it.
HOW CAN LAST YEAR’S SALES MAKE THIS YEAR LOOK WEAKER?
Through the base effect: the starting point changes how impressive—or disappointing—a growth rate looks.
FADA says last year’s GST changes, which took effect on September 22, encouraged buyers to defer purchases before the rollout and then buy during the festive window.
That can distort comparisons in both directions. A subdued period last year makes growth easier this year. An exceptional buying rush makes it harder.
September illustrates the problem. Passenger vehicle retail sales rose 32.1% to 4,27,213 units, their highest September total, according to FADA. Yet the association also cautioned that the annual comparison was distorted by last year’s deferred purchases.
A large growth number still needs its calendar checked.
CAN EVEN THE LENGTH OF THE FESTIVAL CHANGE THE HEADLINE?
Yes.
FADA’s separate Navratri figures cover October 11–20 this year: ten days. Its comparison period last year covered September 22–October 2: eleven days.
Across those windows, total vehicle registrations fell 6.52% year-on-year. Against Navratri 2024, however, they were up 26.76%.
FADA attributed much of the annual decline to the extra day and the GST-related buying surge last year. That is the association’s assessment, rather than proof that every segment is equally healthy.
These Navratri figures cover a different window from Jefferies’ reported fortnight. Their percentages should be read separately.
TRUCK REGISTRATIONS JUMPED 76%. IS THAT A BOOM?
It is a strong increase, amplified by a weak comparison.
According to the Jefferies report cited by ANI, truck registrations had fallen 26% in the corresponding period last year.
Here is the arithmetic. Imagine registrations were 100 in 2024. A 26% fall takes them to 74 in 2025. A subsequent 76% rise takes them to about 130 in 2026.
That leaves registrations roughly 30% above their 2024 level. Spread over two years, the annualised growth rate is around 14%, consistent with the report’s estimate.
Both figures describe the recovery. They give very different impressions of its speed.
DO STRONG TRACTOR SALES PROVE RURAL DEMAND IS HEALTHY?
They provide an encouraging signal, with limits.
Tractor registrations rose 21% during the reported festive fortnight, following 18% growth in April–September.
Jefferies nevertheless flagged risks for the second half of the financial year from a high comparison base and weak monsoon conditions.
Tractors are one part of rural spending. Establishing a broader consumption trend requires evidence on farm incomes, financing and purchases across other categories.
WHAT SHOULD WE WATCH AFTER THE FESTIVE RUSH?
Whether bookings become deliveries, whether registrations remain strong across a longer period, and whether dealers are left holding more stock than they expected.
Inventory needs context too. Business Standard reported that passenger vehicle dealers entered the festive season with around 43–45 days of stock, compared with roughly 60 days a year earlier.
A convincing demand assessment needs those measures together: completed purchases, stock levels and the incentives required to move vehicles.
For now, bikes have the stronger early festive registration figures. Whether cars are losing momentum more durably will become clearer once the full season is counted.