Shopping Frenzy of the Boomtowns
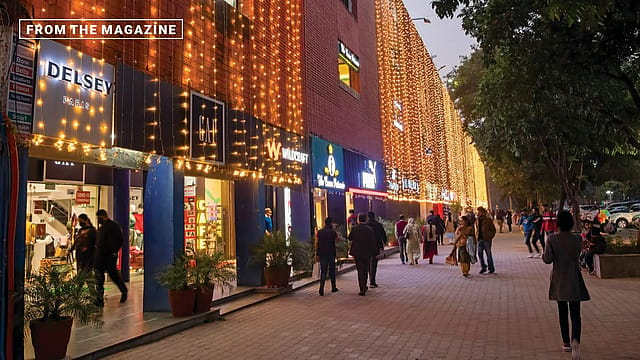
Anitha and Tharun Nair’s family of five does not live extravagantly. The 38-year-old teaches at an aided college in Thiruvananthapuram, while her husband works for an IT company in Technopark. Along with his mother’s pension, they bring in Rs 2.3 lakh a month and spend between Rs 1.3 lakh and Rs 1.5 lakh. The home-loan instalment is Rs 35,000. School fees, tuition and activities for their two children add up to Rs 30,000; groceries and domestic help are another Rs 25,000. Medicines, supplements, gym and insurance cost about Rs 14,000. Then come the car, utilities, phones and other conveniences. The family eats out occasionally and travels once a year. When expenses rise, they postpone an appliance or a shopping trip. “We don’t cut kids’ gym or medical expenses. We wait to buy other things,” Anitha says. This is how new India spends, steadily dividing a good income among the private services required to maintain a modern middle-class life. The household’s annual expenditure happens to be close to the average for a city that a new study of 100 Indian cities identifies as India’s second highest-spending urban centre per household.
The Many Urban Indias study, by the People Research on India’s Consumer Economy (PRICE) and Tata Sons, makes the provocative claim that none of India’s five highest-spending cities per household belongs to the Big Six—Delhi, Mumbai, Bengaluru, Hyderabad, Chennai and Kolkata. Chandigarh leads at Rs 19.2 lakh a year, followed by Thiruvananthapuram at Rs 17.6 lakh, Vadodara at Rs 17.5 lakh, Tiruppur at Rs 16.8 lakh and Surat at Rs 15.5 lakh. Bengaluru, the highest-spending megacity, records Rs 15.3 lakh per household per year. Part of the explanation is compositional. Megacities contain a much larger pool of low-wage and informal workers alongside their high earners, and that wider income distribution can pull down the per-household mean.
According to the study, the top 100 cities together contain 19 per cent of India’s population but generate 35 per cent of income, 31 per cent of consumption and 47 per cent of household surplus. Together, they spend Rs 74.5 lakh crore, or $844 billion, annually. Almost 46 per cent of that demand still comes from the Big Six. Delhi NCR alone has 7.5 million households and constitutes a $126 billion market. Smaller cities have not displaced megacities, but a second geography of demand has formed below them. Lekha Chakraborty, a professor at the National Institute of Public Finance and Policy, calls the study a useful correction to metro-centric narratives. “The study’s core message that prosperity is spreading, but unevenly and still scaled by population size is consistent with the broader data,” she says.
“There is no single rich city,” says Rajesh Shukla, managing director and CEO of PRICE. India’s cities, he says, “are becoming richer in very different ways.” For instance, Bengaluru and Chandigarh share the highest average income, but Bengaluru retains the largest average household surplus, while Chandigarh spends the most and Chennai’s borrowings are the highest. Salaried employment becomes less dominant outside the largest cities and family businesses, professional services, manufacturing, local agriculture, remittances and multiple earners within joint households assume greater importance. Chakraborty traces the leading non-metro markets to different engines: specialised industry in Surat and Tiruppur, administrative concentration in Chandigarh and remittance-augmented incomes in parts of Kerala.
The study says that Big Six households spend 58.3 per cent of their income, against 73.1 per cent in “Boomtowns” with populations between 2.5 million and 10 million, 78.6 per cent in “Breakout cities” with 1.5 million to 2.5 million people, and 76.1 per cent in “Frontier cities” that are smaller still. Growing spending can signal affluence, but it can also mean that households save less. In fact, the share of households classified as overstretched—periodically or chronically unable to meet expenses—rises from 6 per cent in the Big Six to 10.7 per cent in Boomtowns, 13.3 per cent in Breakout cities and 15 per cent in Frontier cities. The Big Six still contain about 1.5 million overstretched households due to their sheer scale—almost as many as all 50 Frontier cities combined.

The report treats Thiruvananthapuram, Kollam, Kottayam, Kochi, Thrissur, Kozhikode and Kannur as a migration-linked urban corridor of roughly 21 million people. Average household income across this corridor is Rs 13.6 lakh and consumption Rs 10.3 lakh, accompanied by relatively high durable ownership and the expenditure demands of a rapidly ageing population. Kerala has long recorded elevated monthly per-capita expenditure in both rural and urban areas, a compressed rural-urban gap, high human-development indicators and substantial Gulf remittances. Chakraborty says these factors support stronger household resources and consumption. The report shows healthy savings and relatively low debt in Thiruvananthapuram and several other leading cities. But a substantial share of Kerala’s spending reflects the life-cycle needs of an ageing population, pensions, healthcare and assets accumulated by earlier migrant generations, rather than the rapid expansion of a young middle class. Consumption can remain elevated for a period on accumulated wealth and pensions even as growth becomes more vulnerable. As Chakraborty says, “Long-run resilience depends on converting past remittance-financed human and physical capital into higher domestic productivity and employment”.
Shukla says Tiruppur was last surveyed between October 2025 and February 2026, after the first American tariff shock, and that the data was added to the principal estimates derived from surveys ending in 2023. The city’s resilience nevertheless deserves investigation. Indian textile exports held at about $37.5 billion in 2025 as firms redirected business towards Europe, the UAE and Japan after the US raised tariffs sharply. In July 2026, the US imposed a further 10 per cent Section 301 duty on affected Indian goods, in addition to normal tariffs. Surat presents the same paradox. Its household spending reflects years of accumulated prosperity, but India’s gem and jewellery exports fell to a five-year low in 2025–26. Shipments to the US dropped 45 per cent and cut-and-polished diamond exports reached their lowest level in more than two decades. Shukla believes second-generation business families are responding by using digital networks to find partners and diversify markets, an interpretation drawn from field discussions rather than the survey itself.
India’s new consumer map also shows high weekend spending. In a separate 2025 module, 6,655 respondents across 25 major cities reported spending Rs 6,724 over the five weekdays and Rs 10,732 over Saturday and Sunday. The weekend accounts for 61.5 per cent of the week’s expenditure. Calculated per day, spending is almost four times as high on a weekend as on a weekday. For Shukla, this is the study’s most revealing “known unknown”. “When households spend may be becoming almost as revealing as how much they spend,” he says. Jaipur’s weekend expenditure is 2.76 times its weekday total, Surat’s is 2.44 times, Pune’s 2.19 times and Kochi’s 2.04 times. Fashion, entertainment, electronics and eating out show the sharpest jumps.
The weekend-to-weekday multiplier rises with income, from 1.37 among respondents earning below Rs 25,000 a month to 2.53 among those earning more than Rs 1 lakh. That makes the surge a plausible expression of a growing middle-income market with money for eating out, entertainment, electronics and fashion, although the 25-city module does not show which income group accounts for the bulk of weekend spending. Using annual household income bands expressed at 2025–26 prices, the study estimates that middle-income households in the top 100 cities increased from 29 per cent of households in 2015–16 to 53 per cent now and projects that they will reach 60 per cent by 2030–31. In absolute terms, that implies an increase from roughly 14 million middle-income households to 33 million now and almost 48 million by 2030–31. But “middle income” here is an exceptionally broad band, earning anywhere from Rs 6 lakh to Rs 36 lakh a year. The high-income group, defined as earning more than Rs 36 lakh, has risen from 3.5 per cent in 2015–16 to about 12 per cent now and is projected to hit 19.6 per cent by 2030–31, or around 15.6 million households.
Food’s share of expenditure is falling while housing, transport, healthcare, education and discretionary categories rise. The study says non-food items now absorb 70 per cent of spending in the 100 cities, against just over 60 per cent a decade ago. The official Household Consumption Expenditure Survey (HCES) points the same way, although not to the same extent. In the 2023–24 HCES, non-food items accounted for 60 per cent of urban expenditure. Urban monthly per-capita consumption increased from Rs 2,630 in 2011-12 to Rs 6,996 in 2023-24 in current prices. The urban-rural consumption gap also narrowed from 84 per cent to 70 per cent. These are among the broader trends Chakraborty says are consistent with demand spreading beyond the traditional metropolitan core. HCES independently identifies Chandigarh as an exceptional spending location. Its urban monthly per-capita expenditure of Rs 13,425 was the highest among Union territories. Even so, the two studies do not operate on the same scale. Dividing PRICE’s average annual household consumption of Rs 12.1 lakh by its average household size of 4.6 produces an implied monthly per-capita figure of nearly Rs 21,900. That is more than three times the official all-urban HCES average and even slightly above the HCES average for urban India’s top 5 per cent, which was Rs 20,310 two years earlier. The gap is largely methodological.
The underlying ICE 360° surveys for PRICE were conducted in 2014, 2016, 2021 and 2023, with reference years extending through 2022–23. They use a three-stage stratified design: cities, wards or blocks, and households. Households are classified across 10 well-being and income-source strata, with 20 selected in each sampled ward. In 2021, 35,040 households in the 100 cities were interviewed. The study’s 2025–26 figures come not from a single contemporaneous survey, they are estimates constructed from those earlier rounds, newer rounds in some cities, official consumption data, the National Family Health Survey, national accounts and population projections.
Shukla says the redesigned PRICE survey achieves city-level sampling errors of approximately 2.3 to 4.2 per cent. The published report, however, does not provide each city’s sample size, median expenditure or confidence interval. The Rs 10,000 annual gap between Thiruvananthapuram and Vadodara is only about 0.6 per cent, for instance, and cannot establish a statistically secure order without those intervals. There is not yet an official household-income dataset against which the income claims can be tested. The NSO’s first nationwide National Household Income Survey is now underway, an indication of the statistical gap PRICE is trying to fill.
Another caveat is that while high private expenditure can reflect aspiration, it can also expose weak public provision. Chakraborty cautions that thinner public services can force households to spend more on housing, health, education and transport. Across the 100 cities, 53.9 per cent of households first seek treatment from private facilities and only 36.1 per cent report cover under any health-insurance scheme. Among households experiencing hospitalisation, nearly 4 per cent saw their surplus turn negative. A high expense budget, therefore, is not necessarily a measure of greater welfare.
Chennai is the report’s outlier on leverage. It puts the city’s average household debt at Rs 5.3 lakh and its debt-to-income ratio at 27.7 per cent, the highest across all 100 cities. Chennai households also spend 67 per cent of their income, the highest share among the Big Six. Shukla believes the leverage reflects housing, gold and other asset creation rather than everyday consumption. Chakraborty similarly cautions that high housing or land values can make a city appear less saver-friendly than its household balance sheets imply, and says surplus figures should be read alongside asset data. But the report does not publish city-level borrowing purposes. Nationally, the RBI says consumption loans have been the principal driver of household debt, which reached 45.5 per cent of GDP by September 2025, while gold-backed lending has expanded particularly quickly. Leverage cannot automatically be treated as wealth creation.
Businesses already know that the Indian consumer map has widened. Tata’s Trent, for instance, now operates 1,312 stores in 330 cities, against 1,043 stores in 242 cities a year earlier. Its expansion beyond the metros has been driven largely by Zudio, its youth-focused value-fashion chain. Amazon says customers for its low-priced Bazaar platform grew eightfold in Tier-II and Tier-III cities in a year. Thomas Cook’s transaction data put Tier-II and Tier-III cities at 53 per cent of forex demand. These figures fit the wider evidence from organised-sector hiring, D2C commerce, logistics and manufacturing. They support the PRICE study’s central proposition that demand is no longer confined to metros.
The physical city has yet to catch up. If almost two-thirds of expenditure occurs on the weekend, Shukla argues, transport, electricity, retail staffing, sanitation, policing and public spaces must be planned differently for those 104 days. Weekly markets used heavily by lower-income households require lighting, toilets and security. And smaller cities that fail to supply education, healthcare, mobility and liveable streets may eventually lose the consumers they have created.